
Visualizations Example
Frontend and API with Next.js and GraphQL
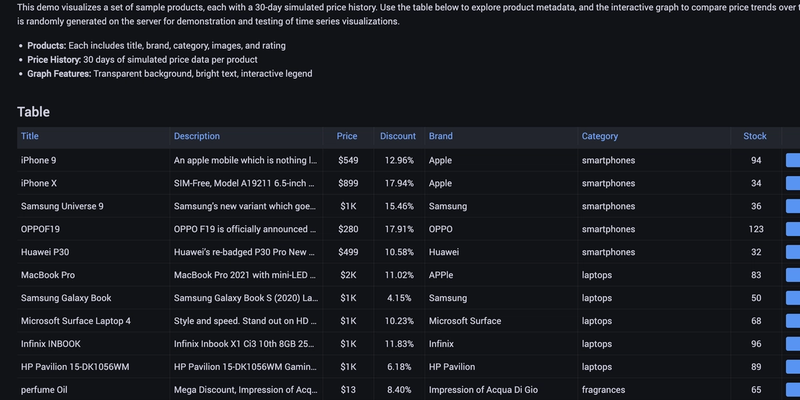
This demo visualizes a set of sample products, each with a 30-day simulated price history. Use the table below to explore product metadata, and the interactive graph to compare price trends over time. Click or double-click legend entries to focus on individual products. The data is randomly generated on the server for demonstration and testing of time series visualizations.
- Products: Each includes title, brand, category, images, and rating
- Price History: 30 days of simulated price data per product
- Graph Features: Transparent background, bright text, interactive legend
API Repository: https://github.com/jesshmusic/grafana-example-api
Tech Stack
- ReactJS
- NodeJS
- Next.js
- GraphQL